
Population Statistics for
Kotzebue Regional Jail Facility
There are 12 beds and 2 -individual "Holding Cells"
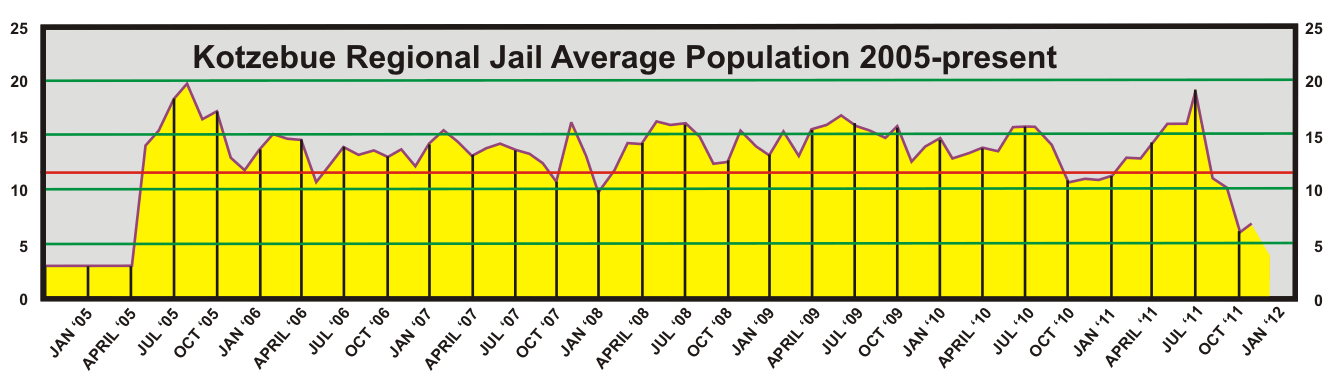
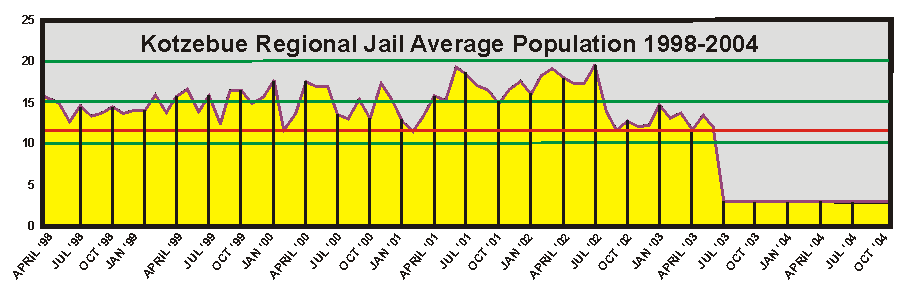
The Red Line is the Jail Capacity number of 12.
The Purple line is the average of everyone held each day, which "normal" is usually closer to 15.
Statistics from April, 1998 to Present
Latest months at the top.
Highest months (over 140%) are in Yellow.
"--" is uncalculated or unavailable data.
|
|
|
|
|
|
|
|
|
| May, 2012 | 94 | 67/27 | 4-16 | 9.48 | 79% | 12 | 292.5 |
| April, 2012 | 79 | 63/16 | 3-15 | 9.26 | 77% | 7 | 278 |
| March, 2012 | 74 | 57/17 | 2-13 | 7.22 | 60% | 6 | 222 |
| February, 2012 | 23 | 18/5 | 0-4 | 1.34 | 11% | - | 35.5 |
| January, 2012 | 40 | 29/11 | 0-9 | 2.26 | 19% | - | 68 |
|
|
|
|
|
|
|
|
|
| December, 2011 | 32 | 24/8 | 0-5 | 1.7 | 14% | - | 50.5 |
KRJ closed for December, 2011 January and February, 2012 to State prisoners.
After was a Very Firm cap of 12 prisoners (More transports).
|
|
|
|
|
|
|
|
|
| November, 2011 | 65 | 57/8 | 2-12 | 6.66 | 56% | 9 | 195.5 |
| October, 2011 | 66 | 56/10 | 0-12 | 6.0 | 50% | 9 | 183 |
| September, 2011 | 90 | 60/30 | 4-16 | 9.96 | 83% | 8 | 264 |
| August, 2011 | 90 | 73/17 | 4-17 | 10.58 | 88% | 9 | 317.5 |
| July, 2011 | 150 | 116/34 | 13-29 | 19.29 | 161% | 10 | 585 |
| June, 2011 | 109 | 82/27 | 10-23 | 15.93 | 133% | 6 | 478.5 |
| May, 2011 | 99 | 67/32 | 10-26 | 16.38 | 137% | 8 | 498 |
| April, 2011 | 92 | 63/29 | 5-28 | 14.6 | 122% | 5 | 417.5 |
| March, 2011 | 79 | 62/17 | 5-25 | 13.54 | 113% | 5 | 417.5 |
| February, 2011 | 66 | 50/16 | 7-22 | 13.64 | 114% | 5 | 380 |
| January, 2011 | 58 | 48/10 | 7-17 | 11.22 | 94% | 3 | 342.5 |
|
|
|
|
|
|
|
|
|
| December, 2010 | 76 | 57/19 | 8-15 | 10.83 | 90% | 7 | 342.5 |
| November, 2010 | 60 | 45/15 | 5-20 | 11.86 | 99% | 6 | 321 |
| October, 2010 | 62 | 48/14 | 5-17 | 10.64 | 89% | 6 | 329.5 |
| September, 2010 | 77 | 59/18 | 7-23 | 13.46 | 112% | 7 | 397.5 |
| August, 2010 | 113 | 86/27 | 9-27 | 15.7 | 131% | 8 | 370.5 |
| July, 2010 | 117 | 91/26 | 7-25 | 15.7 | 131% | 10 | 478.5 |
| June, 2010 | 93 | 78/15 | 10-27 | 15.6 | 130% | 8 | 473.0 |
| May, 2010 | 90 | 66/24 | 4-23 | 13.35 | 111% | 10 | 406.5 |
| April, 2010 | 79 | 59/20 | 6-19 | 13.87 | 116% | 8 | 401 |
| March, 2010 | 69 | 58/11 | 6-21 | 12.52 | 104% | 8 | 384.5 |
| February, 2010 | 58 | 44/14 | 5-24 | 12.36 | 104% | 7 | 332 |
| January, 2010 | 88 | 68/20 | 7-26 | 14.8 | 123% | 10 | 447 |
(Note - City-Run liquor store opened 8-25-10)
|
|
|
|
|
|
|
|
|
| December, 2009 | 74 | 60/14 | 6-28 | 14.29 | 119% | 9 | 445 |
| November, 2009 | 65 | 50/15 | 4-21 | 12.36 | 103% | 8 | 370.5 |
| October, 2009 | 96 | 77/19 | 8-24 | 16.22 | 135% | 8 | 505 |
| September, 2009 | 74 | 64/13 | 5-27 | 14.76 | 123% | 9 | 424.5 |
| August, 2009 | 82 | 63/19 | 10-25 | 16.13 | 134% | 8 | 457 |
| July, 2009 | 92 | 72/20 | 7-21 | 15.93 | 133% | 6 | 460 |
| June, 2009 * | 112 | 80/32 | 9-30 | 16.8 | 140% | 10 | 496.5 |
| May, 2009 | 106 | 82/24 | 6-24 | 15.93 | 133% | 10 | 487.5 |
| April, 2009 | 87 | 70/17 | 11-25 | 15.6 | 130% | 12 | 477 |
| March, 2009 | 76 | 58/18 | 7-24 | 13.16 | 110% | 6 | 401 |
| February, 2009 | 75 | 64/11 | 8-23 | 15.39 | 128% | 9 | 425.5 |
| January, 2009 | 93 | 77/17 | 7-17 | 13.23 | 110% | 12 | 419 |
|
|
|
|
|
|
|
|
|
| December, 2008 | 86 | 81/5 | 6-25 | 13.93 | 116% | 10 | 445 |
| November, 2008 | 104 | 95/9 | 7-24 | 15.4 | 128% | 7 | 439 |
| October, 2008 | 85 | 65/20 | 6-20 | 12.61 | 105% | 7 | 392 |
| September, 2008 | 82 | 59/23 | 7-21 | 12.4 | 103% | 9 | 375.5 |
| August, 2008 | 111 | 93/18 | 9-23 | 14.87 | 124% | 10 | 478.5 |
| July, 2008 | 107 | 77/30 | 6-26 | 16.20 | 135% | 10 | 438.5 |
| June, 2008 | 103 | 80/23 | 6-26 | 16.03 | 134% | 9 | 484.5 |
| May, 2008 | 102 | 80/22 | 8-31 | 16.35 | 136% | 9 | 477 |
| April, 2008 | 99 | 78/21 | 8-26 | 14.23 | 119% | 9 | 405 |
| March, 2008 | 96 | 77/19 | 7-25 | 14.19 | 118% | 10 | 434.5 |
| February, 2008 | 73 | 52/21 | 6-20 | 11.79 | 98% | 8 | 329.5 |
| January, 2008 | 75 | 55/20 | 7-19 | 9.70 | 81% | 10 | 291.0 |
|
|
|
|
|
|
|
|
|
| December, 2007 | 74 | 51/23 | 8-22 | 13.03 | 109% | 9 | 395.5 |
| November, 2007 | 113 | 96/17 | 11-23 | 16.13 | 134% | 7 | 467 |
| October, 2007 | 75 | 6015 | 6-17 | 10.74 | 90% | 9 | 330.5 |
| September, 2007 | 99 | 79/20 | 5-23 | 12.43 | 104% | 9 | 376 |
| August, 2007 | 85 | 55/30 | 6-22 | 13.32 | 111% | 11 | 407.5 |
| July, 2007 | 120 | 82/38 | 2-25 | 13.67 | 114% | 10 | 422 |
| June, 2007 | 99 | 68/31 | 8-23 | 14.2 | 118% | 9 | 436.5 |
| May, 2007 | 93 | 73/20 | 7-20 | 13.83 | 115% | 10 | 441.5 |
| April, 2007 | 100 | 84/16 | 7-25 | 13.2 | 110% | 10 | 381.5 |
| March, 2007 | 107 | 90/17 | 8-21 | 14.32 | 119% | 9 | 430 |
| February, 2007 | 92 | 78/14 | 9-23 | 15.39 | 128% | 12 | 426 |
| January, 2007 | 102 | 75/27 | 8-22 | 14.29 | 119% | 10 | 437 |
|
|
|
|
|
|
|
|
|
| December, 2006 | 95 | 76/19 | 6-25 | 12.22 | 102% | 12 | 372.5 |
| November, 2006 | 112 | 90/22 | 6-23 | 13.63 | 114% | 13 | 405 |
| October, 2006 | 95 | 81/14 | 8-20 | 12.97 | 108% | 10 | 389.5 |
| September, 2006 | 109 | 89/20 | 7-19 | 13.56 | 104% | 10 | 401.5 |
| August, 2006 | 111 | 85/26 | 5-22 | 13.19 | 109% | 11 | 385 |
| July, 2006 | 98 | 86/11 | 8-21 | 13.80 | 115% | 12 | 427 |
| June, 2006 | 68 | 57/11 | 6-21 | 12.29 | 102% | 9 | 357.5 |
| May, 2006 | 91 | 68/23 | 6-16 | 10.70 | 89% | 10 | 511.5 |
| April, 2006 | 94 | 79/15 | 9-26 | 14.53 | 121% | 9 | 422.5 |
| March, 2006 | 97 | 83/14 | 7-23 | 14.74 | 122% | 14 | 427 |
| February, 2006 | 98 | 82/16 | 11-27 | 15.11 | 125% | 8 | 425 |
| January, 2006 | 96 | 77/19 | 8-24 | 13.64 | 113% | 9 | 436 |
On May 1, 2005 KRJ re-opened to State Prisoners. The "cap" of 12 was again in effect, but the numbers were immediately large.
|
|
|
|
|
|
|
|
|
| December, 2005 | 84 | 75/9 | 3-20 | 11.80 | 98% | 10 | 397 |
| November, 2005 | 89 | 75/14 | 4-20 | 12.86 | 107% | 9 | 416 |
| October, 2005 | 125 | 101/24 | 9-26 | 17.16 | 143% | 18 | 530 |
| September, 2005 | 120 | 97/23 | 11-30 | 16.56 | 138% | 11 | 508.5 |
| August, 2005 | 153 | 125/28 | 12-29 | 19.64 | 163% | 16 | 581.5 |
| July, 2005 | 178 | 142/36 | 7-25 | 18.29 | 152% | 16 | 570.5 |
| June, 2005 | 125 | 104/21 | 4-28 | 15.46 | 128% | 14 | 446 |
| May, 2005 | 103 | 81/22 | 4-25 | 14.09 | 117% | 12 | 557.5 |
After June 30, 2003, KRJ was only pre-arraignment and holding only locally arrested prisoners until arraignment. It didn't hold state prisoners (Village) at all, nor for court appointments, so numbers are significantly lower. The village arrests were held at a holding facility run by the Alaska State Troopers. Village arrestee's accounted for 50-60% of population before change of status. Some % stats too insignificant to calculate. # of Transports isn't recorded by KRJ but were almost daily.
|
|
|
|
|
|
|
|
|
| April, 2005 | 24 | 20/4 | 0-# | -- | --% | -- | 33 |
| March, 2005 | 39 | 27/12 | 0-# | -- | --% | -- | 61.5 |
| February, 2005 | 20 | 19/1 | 0-# | -- | --% | -- | 28.5 |
| January, 2005 | 30 | 21/9 | 0-# | -- | --% | -- | 46 |
|
|
|
|
|
|
|
|
|
| December, 2004 | 27 | 16/11 | 0-# | -- | --% | -- | 30.5 |
| November, 2004 | 39 | 33/6 | 0-# | -- | --% | -- | 58.5 |
| October, 2004 | 55 | 40/15 | 0-# | -- | --% | -- | 76 |
| September, 2004 | 52 | 39/13 | 0-# | -- | --% | -- | 69.5 |
| August, 2004 | 47 | 32/15 | 0-# | -- | --% | -- | 69.5 |
| July, 2004 | 40 | 28/12 | 0-# | -- | --% | -- | 60 |
| June, 2004 | 24 | 16/8 | 0-# | -- | --% | -- | 36 |
| May, 2004 | 22 | 14/8 | 0-# | -- | --% | -- | 29 |
| April, 2004 | 31 | 26/5 | 0-# | -- | --% | -- | 47.5 |
| March, 2004 | 18 | 14/4 | 0-# | -- | --% | -- | 28.5 |
| February, 2004 | 31 | 24/7 | 0-4 | -- | --% | -- | 46.5 |
| January, 2004 | 20 | 11/9 | 0-5 | -- | --% | -- | 29 |
|
|
|
|
|
|
|
|
|
| December, 2003 | 12 | 10/2 | 0-3 | -- | --% | -- | 28.5 |
| November, 2003 | 28 | 22/6 | 0-5 | -- | --% | -- | 39 |
| October, 2003 | 24 | 18/6 | 0-3 | -- | --% | -- | 41 |
| September, 2003 | 22 | 14/8 | 0-2 | -- | --% | -- | 35.5 |
| August, 2003 | 26 | 19/7 | 0-3 | 1.35 | 11% | -- | 41 |
| July, 2003 | 65 | 45/20 | 0-8 | 3.06 | 26% | -- | 86.5 |